Souporcell is a genotype-free demultiplexing software that does not require you to have SNP genotypes the donors in your multiplexed capture.
However, it can natively integrate SNP genotypes into the demultiplexing if you have them available for all the donors in your pool.
If you don’t have the reference SNP genotypes for all the donors in your multiplexed pool, we have provided some scripts that will help identify clusters from given donors after running Souporcell without the SNP genotypes.
Depending on your downstream analyses, if you have reference SNP genotypes for donors in your pool, you could also use Demuxlet, or Vireo.
One advantage that we have found immensely helpful about Souporcell is that it provides an ambient RNA estimate for the pool.
This can be helpful to identify samples that may have high ambient RNA estimates early in the analysis pipeline so that it can be accounted for throughout downstream analyses.
First, let’s assign the variables that will be used to execute each step.
Example Variable Settings
Below is an example of the variables that we can set up to be used in the command below.
These are files provided as a test dataset available in the Data Preparation Documentation
Please replace paths with the full path to data on your system.
~37h using a total of 45Gb memory when using 5 threads for the full Test Dataset which contains ~20,982 droplets of 13 multiplexed donors,
You can run Souporcell with or without reference SNP genotypes - follow the instructions for each bellow:
Please note that the \ at the end of each line is purely for readability to put a separate parameter argument on each line.
If you don’t have reference SNP genotypes for all of your donors, you can run souporcell with the following command, providing an appropriate thread number ($THREADS) for your system .
Don’t worry if you only have reference SNP genotypes for a subset of your donors, we have a script that will correlate the cluster and reference SNP genotypes.
If you receive an error indicating that a file or directory doesn’t exist but you are sure that it does, this is likely an issue arising from Singularity.
This is easy to fix.
The issue and solution are explained in detail in the Notes About Singularity Images
If you have reference SNP genotypes for all of your donors, you can run souporcell with the following command, providing an appropriate thread number ($THREADS) for your system and listing the donor ids that correspond in the $VCF file
If you receive an error indicating that a file or directory doesn’t exist but you are sure that it does, this is likely an issue arising from Singularity.
This is easy to fix.
The issue and solution are explained in detail in the Notes About Singularity Images
Note
Souporcell can currently only be executed when either all or none of the individuals that have been pooled have SNP genotypes.
Further, the output still has cluster numbers but they should correspond to the order that you listed your individuals.
For example, if you have two individuals in your pool (donorA and donorB) and input them as --known_genotypes_sample_namesdonorAdonorB, then the output will have two clusters: 0 and 1.
donorA will correspond to 0 and donorB will correspond to 1.
Even when we have reference SNP genotypes, we typically runn Souporcell without reference SNP genotypes and then use the cluster vs individual correlations (below) to assign clusters to individuals.
If Souporcell is successful, you will have these files in your $SOUPORCELL_OUTDIR:
We have provided a script that will provide a summary of the number of droplets classified as doublets, ambiguous and assigned to each cluster by Souporcell.
You can run this to get a fast and easy summary of your results by providing the souporcell result file:
Correlating Cluster to Donor Reference SNP Genotypes (optional)
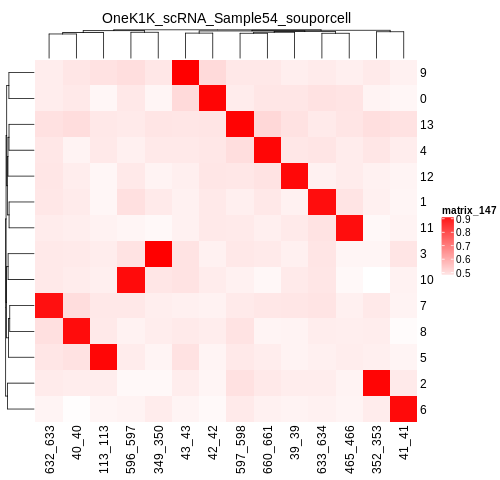
If you have reference SNP genotypes for some or all of the donors in your pool, you can identify which cluster is best correlated with each donor in your reference SNP genotypes. We have provided a script that will do this and provide a heatmap correlation figure and the predicted individual that should be assigned for each cluster. You can either run it with the script by providing the reference SNP genotypes ($VCF), the cluster SNP genotypes ($SOUPORCELL_OUTDIR/cluster_genotypes.vcf) and the output directory ($SOUPORCELL_OUTDIR) You can run this script with:
Note
In order to do this, your $VCF must be reference SNP genotypes for the individuals in the pool and cannot be a general vcf with common SNP genotype locations from 1000 Genomes or HRC.
Please note that the \ at the end of each line is purely for readability to put a separate parameter argument on each line.
You can run the reference vs cluster genotypes manually (possibly because your data doesn’t have GT, DS or GP genotype formats) or because you would prefer to alter some of the steps.
To run the correlations manually, simply start R from the singularity image:
singularityexecDemuxafy.sifR
Once, R has started, you can load the required libraries (included in the singularity image) and run the code.
.libPaths("/usr/local/lib/R/site-library")### Required so that libraries are loaded from the image instead of locally
library(tidyr)
library(tidyverse)
library(dplyr)
library(vcfR)
library(lsa)
library(ComplexHeatmap)########## Set up paths and variables ##########
reference_vcf<-"/path/to/reference.vcf"
cluster_vcf<-"/path/to/souporcell/out/cluster_genotypes.vcf"
outdir<-"/path/to/souporcell/out/"########## Set up functions ############### Calculate DS from GP if genotypes in that format #####
calculate_DS<-function(GP_df){columns<-c()for(iin1:ncol(GP_df)){columns<-c(columns,paste0(colnames(GP_df)[i],"-0"),paste0(colnames(GP_df)[i],"-1"),paste0(colnames(GP_df)[i],"-2"))}df<-GP_df
colnames(df)<-paste0("c",colnames(df))colnames_orig<-colnames(df)for(iin1:length(colnames_orig)){df<-separate(df,sep=",",col=colnames_orig[i],into=columns[(1+(3*(i-1))):(3+(3*(i-1)))])}df<-mutate_all(df,function(x)as.numeric(as.character(x)))for(iin1:ncol(GP_df)){GP_df[,i]<-df[,(2+((i-1)*3))]+2*df[,(3+((i-1)*3))]}return(GP_df)}
pearson_correlation<-function(df,ref_df,clust_df){for(colincolnames(df)){for(rowinrownames(df)){df[row,col]<-cor(as.numeric(pull(ref_df,col)),as.numeric(pull(clust_df,row)),method="pearson",use="complete.obs")}}return(df)}########## Read in vcf files for each of three non-reference genotype softwares ##########
ref_geno<-read.vcfR(reference_vcf)
cluster_geno<-read.vcfR(cluster_vcf)########## Convert to tidy data frame ################# Identify which genotype FORMAT to use ############ Cluster VCF ######## Check for each of the different genotype formats #### DS ##format_clust=NA
cluster_geno_tidy<-as_tibble(extract.gt(element="DS",cluster_geno,IDtoRowNames=F))if(!all(colSums(is.na(cluster_geno_tidy))==nrow(cluster_geno_tidy))){message("Found DS genotype format in cluster vcf. Will use that metric for cluster correlation.")format_clust="DS"}## GT ##if(is.na(format_clust)){cluster_geno_tidy<-as_tibble(extract.gt(element="GT",cluster_geno,IDtoRowNames=F))if(!all(colSums(is.na(cluster_geno_tidy))==nrow(cluster_geno_tidy))){message("Found GT genotype format in cluster vcf. Will use that metric for cluster correlation.")format_clust="GT"if(any(grepl("\\|",cluster_geno_tidy[1,]))){separator="|"message("Detected | separator for GT genotype format in cluster vcf")}elseif(any(grepl("/",cluster_geno_tidy[1,]))){separator="/"message("Detected / separator for GT genotype format in cluster vcf")}else{format_clust=NA
message("Can't identify a separator for the GT field in cluster vcf, moving on to using GP.")}cluster_geno_tidy<-as_tibble(lapply(cluster_geno_tidy,function(x){gsub(paste0("0",separator,"0"),0,x)})%>%
lapply(.,function(x){gsub(paste0("0",separator,"1"),1,x)})%>%
lapply(.,function(x){gsub(paste0("1",separator,"0"),1,x)})%>%
lapply(.,function(x){gsub(paste0("1",separator,"1"),2,x)}))}}## GP ##if(is.na(format_clust)){cluster_geno_tidy<-as_tibble(extract.gt(element="GP",cluster_geno,IDtoRowNames=F))if(!all(colSums(is.na(cluster_geno_tidy))==nrow(cluster_geno_tidy))){format_clust="GP"cluster_geno_tidy<-calculate_DS(cluster_geno_tidy)message("Found GP genotype format in cluster vcf. Will use that metric for cluster correlation.")}else{print("Could not identify the expected genotype format fields (DS, GT or GP) in your cluster vcf. Please check the vcf file and make sure that one of the expected genotype format fields is included or run manually with your genotype format field of choice. Quitting")q()}}### Reference VCF ###### Check for each of the different genotype formats #### DS ##format_ref=NA
ref_geno_tidy<-as_tibble(extract.gt(element="DS",ref_geno,IDtoRowNames=F))if(!all(colSums(is.na(ref_geno_tidy))==nrow(ref_geno_tidy))){message("Found DS genotype format in reference vcf. Will use that metric for cluster correlation.")format_ref="DS"}## GT ##if(is.na(format_ref)){ref_geno_tidy<-as_tibble(extract.gt(element="GT",ref_geno,IDtoRowNames=F))if(!all(colSums(is.na(ref_geno_tidy))==nrow(ref_geno_tidy))){message("Found GT genotype format in reference vcf. Will use that metric for cluster correlation.")format_ref="GT"if(any(grepl("\\|",ref_geno_tidy[1,]))){separator="|"message("Detected | separator for GT genotype format in reference vcf")}elseif(any(grepl("/",ref_geno_tidy[1,]))){separator="/"message("Detected / separator for GT genotype format in reference vcf")}else{format_ref=NA
message("Can't identify a separator for the GT field in reference vcf, moving on to using GP.")}ref_geno_tidy<-as_tibble(lapply(ref_geno_tidy,function(x){gsub(paste0("0",separator,"0"),0,x)})%>%
lapply(.,function(x){gsub(paste0("0",separator,"1"),1,x)})%>%
lapply(.,function(x){gsub(paste0("1",separator,"0"),1,x)})%>%
lapply(.,function(x){gsub(paste0("1",separator,"1"),2,x)}))}}## GP ##if(is.na(format_ref)){ref_geno_tidy<-as_tibble(extract.gt(element="GP",ref_geno,IDtoRowNames=F))if(!all(colSums(is.na(ref_geno_tidy))==nrow(ref_geno_tidy))){format_clust="GP"ref_geno_tidy<-calculate_DS(ref_geno_tidy)message("Found GP genotype format in cluster vcf. Will use that metric for cluster correlation.")}else{print("Could not identify the expected genotype format fields (DS, GT or GP) in your cluster vcf. Please check the vcf file and make sure that one of the expected genotype format fields is included or run manually with your genotype format field of choice. Quitting")q()}}### Get SNP IDs that will match between reference and cluster ##### Account for possibility that the ref or alt might be missingif((all(is.na(cluster_geno@fix[,'REF']))&all(is.na(cluster_geno@fix[,'ALT'])))|(all(is.na(ref_geno@fix[,'REF']))&all(is.na(ref_geno@fix[,'ALT'])))){message("The REF and ALT categories are not provided for the reference and/or the cluster vcf. Will use just the chromosome and position to match SNPs.")cluster_geno_tidy$ID<-paste0(cluster_geno@fix[,'CHROM'],":",cluster_geno@fix[,'POS'])ref_geno_tidy$ID<-paste0(ref_geno@fix[,'CHROM'],":",ref_geno@fix[,'POS'])}elseif(all(is.na(cluster_geno@fix[,'REF']))|all(is.na(ref_geno@fix[,'REF']))){message("The REF categories are not provided for the reference and/or the cluster vcf. Will use the chromosome, position and ALT to match SNPs.")cluster_geno_tidy$ID<-paste0(cluster_geno@fix[,'CHROM'],":",cluster_geno@fix[,'POS'],"_",cluster_geno@fix[,'REF'])ref_geno_tidy$ID<-paste0(ref_geno@fix[,'CHROM'],":",ref_geno@fix[,'POS'],"_",ref_geno@fix[,'REF'])}elseif(all(is.na(cluster_geno@fix[,'ALT']))|all(is.na(ref_geno@fix[,'ALT']))){message("The ALT categories are not provided for the reference and/or the cluster vcf. Will use the chromosome, position and REF to match SNPs.")cluster_geno_tidy$ID<-paste0(cluster_geno@fix[,'CHROM'],":",cluster_geno@fix[,'POS'],"_",cluster_geno@fix[,'ALT'])ref_geno_tidy$ID<-paste0(ref_geno@fix[,'CHROM'],":",ref_geno@fix[,'POS'],"_",ref_geno@fix[,'ALT'])}else{message("Found REF and ALT in both cluster and reference genotype vcfs. Will use chromosome, position, REF and ALT to match SNPs.")cluster_geno_tidy$ID<-paste0(cluster_geno@fix[,'CHROM'],":",cluster_geno@fix[,'POS'],"_",cluster_geno@fix[,'REF'],"_",cluster_geno@fix[,'ALT'])ref_geno_tidy$ID<-paste0(ref_geno@fix[,'CHROM'],":",ref_geno@fix[,'POS'],"_",ref_geno@fix[,'REF'],"_",ref_geno@fix[,'ALT'])}### Update the vcf dfs to remove SNPs with no genotyopes
cluster_geno_tidy<-cluster_geno_tidy[colSums(!is.na(cluster_geno_tidy))>0]
ref_geno_tidy<-ref_geno_tidy[colSums(!is.na(ref_geno_tidy))>0]########## Get a unique list of SNPs that is in both the reference and cluster genotypes ##########
locations<-inner_join(ref_geno_tidy[,"ID"],cluster_geno_tidy[,"ID"])
locations<-locations[!(locations$ID%in%locations[duplicated(locations),]$ID),]########## Keep just the SNPs that overlap ##########
ref_geno_tidy<-left_join(locations,ref_geno_tidy)
cluster_geno_tidy<-left_join(locations,cluster_geno_tidy)########## Correlate all the cluster genotypes with the individuals genotyped ############### Make a dataframe that has the clusters as the row names and the individuals as the column names #####
pearson_correlations<-as.data.frame(matrix(nrow=(ncol(cluster_geno_tidy)-1),ncol=(ncol(ref_geno_tidy)-1)))
colnames(pearson_correlations)<-colnames(ref_geno_tidy)[2:(ncol(ref_geno_tidy))]
rownames(pearson_correlations)<-colnames(cluster_geno_tidy)[2:(ncol(cluster_geno_tidy))]
pearson_correlations<-pearson_correlation(pearson_correlations,ref_geno_tidy,cluster_geno_tidy)
cluster<-data.frame("Cluster"=rownames(pearson_correlations))
pearson_correlations_out<-cbind(cluster,pearson_correlations)########## Save the correlation dataframes ##########
write_delim(pearson_correlations_out,file=paste0(outdir,"/ref_clust_pearson_correlations.tsv"),delim="\t")########## Create correlation figures ##########col_fun=colorRampPalette(c("white","red"))(101)
pPearsonCorrelations<-Heatmap(as.matrix(pearson_correlations),cluster_rows=T,col=col_fun)########## Save the correlation figures ##########
png(filename=paste0(outdir,"/ref_clust_pearson_correlation.png"),width=500)
print(pPearsonCorrelations)
dev.off()########## Assign individual to cluster based on highest correlating individual ##########
key<-as.data.frame(matrix(nrow=ncol(pearson_correlations),ncol=3))
colnames(key)<-c("Genotype_ID","Cluster_ID","Correlation")
key$Genotype_ID<-colnames(pearson_correlations)for(idinkey$Genotype_ID){if(max(pearson_correlations[,id])==max(pearson_correlations[rownames(pearson_correlations)[which.max(pearson_correlations[,id])],])){key$Cluster_ID[which(key$Genotype_ID==id)]<-rownames(pearson_correlations)[which.max(pearson_correlations[,id])]key$Correlation[which(key$Genotype_ID==id)]<-max(pearson_correlations[,id])}else{key$Cluster_ID[which(key$Genotype_ID==id)]<-"unassigned"key$Correlation[which(key$Genotype_ID==id)]<-NA
}}
write_delim(key,file=paste0(outdir,"/Genotype_ID_key.txt"),delim="\t")
After correlating the cluster and reference donor SNP genotypes, you should have the new results in your directory:
If the souporcell summary is successful, you will have this new file in your $SOUPORCELL_OUTDIR:
After running the Souporcell steps and summarizing the results, you will have a number of files from some of the intermediary steps.
These are the files that most users will find the most informative: