ScSplit is a reference-free demultiplexing software. If you have reference SNP genotypes, it would be better to use a demultiplexing software that can handle reference SNP genotypes (Demuxlet, Souporcell or Vireo)
First, let’s assign the variables that will be used to execute each step.
Example Variable Settings
Below is an example of the variables that we can set up to be used in the command below.
These are files provided as a test dataset available in the Data Preparation Documentation
Please replace paths with the full path to data on your system.
~7h using a total of 6.5Gb memory when using 8 threads for the full Test Dataset which contains ~20,982 droplets of 13 multiplexed donors,
First, let’s check to make sure that the bam file and vcf file are on the same reference for matching chromosome encoding (ie UCSC = hg38 = chr1, chr2, chr3… vs ENSEMBL/NCBI = GRCh38 = 1, 2, 3…)
If you receive an error indicating that a file or directory doesn’t exist but you are sure that it does, this is likely an issue arising from Singularity.
This is easy to fix.
The issue and solution are explained in detail in the Notes About Singularity Images
After running these bam preparation steps, you will have the following files in your $SCSPLIT_OUTDIR:
We have provided a script that will provide a summary of the number of droplets classified as doublets, ambiguous and assigned to each cluster by ScSplit.
You can run this to get a fast and easy summary of your results.
Just pass the ScSplit result file:
To check if these numbers are consistent with the expected doublet rate in your dataset, you can use our Doublet Estimation Calculator.
Correlating Cluster to Donor Reference SNP Genotypes (optional)
If you have reference SNP genotypes for some or all of the donors in your pool, you can identify which cluster is best correlated with each donor in your reference SNP genotypes. We have provided a script that will do this and provide a heatmap correlation figure and the predicted individual that should be assigned for each cluster. You can either run it with the script by providing the reference SNP genotypes ($VCF), the cluster SNP genotypes ($SCSPLIT_OUTDIR/scSplit.vcf) and the output directory ($SCSPLIT_OUTDIR) You can run this script with:
Note
In order to do this, your $VCF must be reference SNP genotypes for the individuals in the pool and cannot be a general vcf with common SNP genotype locations from 1000 Genomes or HRC.
You can run the reference vs cluster genotypes manually (possibly because your data doesn’t have GT, DS or GP genotype formats) or because you would prefer to alter some of the steps.
To run the correlations manually, simply start R from the singularity image:
singularityexecDemuxafy.sifR
Once, R has started, you can load the required libraries (included in the singularity image) and run the code.
.libPaths("/usr/local/lib/R/site-library")### Required so that libraries are loaded from the image instead of locally
library(tidyr)
library(tidyverse)
library(dplyr)
library(vcfR)
library(lsa)
library(ComplexHeatmap)########## Set up paths and variables ##########
reference_vcf<-"/path/to/reference.vcf"
cluster_vcf<-"/path/to/scSplit/out/scSplit.vcf"
outdir<-"/path/to/scSplit/out/"########## Set up functions ############### Calculate DS from GP if genotypes in that format #####
calculate_DS<-function(GP_df){columns<-c()for(iin1:ncol(GP_df)){columns<-c(columns,paste0(colnames(GP_df)[i],"-0"),paste0(colnames(GP_df)[i],"-1"),paste0(colnames(GP_df)[i],"-2"))}df<-GP_df
colnames(df)<-paste0("c",colnames(df))colnames_orig<-colnames(df)for(iin1:length(colnames_orig)){df<-separate(df,sep=",",col=colnames_orig[i],into=columns[(1+(3*(i-1))):(3+(3*(i-1)))])}df<-mutate_all(df,function(x)as.numeric(as.character(x)))for(iin1:ncol(GP_df)){GP_df[,i]<-df[,(2+((i-1)*3))]+2*df[,(3+((i-1)*3))]}return(GP_df)}
pearson_correlation<-function(df,ref_df,clust_df){for(colincolnames(df)){for(rowinrownames(df)){df[row,col]<-cor(as.numeric(pull(ref_df,col)),as.numeric(pull(clust_df,row)),method="pearson",use="complete.obs")}}return(df)}########## Read in vcf files for each of three non-reference genotype softwares ##########
ref_geno<-read.vcfR(reference_vcf)
cluster_geno<-read.vcfR(cluster_vcf)########## Convert to tidy data frame ################# Identify which genotype FORMAT to use ############ Cluster VCF ######## Check for each of the different genotype formats #### DS ##format_clust=NA
cluster_geno_tidy<-as_tibble(extract.gt(element="DS",cluster_geno,IDtoRowNames=F))if(!all(colSums(is.na(cluster_geno_tidy))==nrow(cluster_geno_tidy))){message("Found DS genotype format in cluster vcf. Will use that metric for cluster correlation.")format_clust="DS"}## GT ##if(is.na(format_clust)){cluster_geno_tidy<-as_tibble(extract.gt(element="GT",cluster_geno,IDtoRowNames=F))if(!all(colSums(is.na(cluster_geno_tidy))==nrow(cluster_geno_tidy))){message("Found GT genotype format in cluster vcf. Will use that metric for cluster correlation.")format_clust="GT"if(any(grepl("\\|",cluster_geno_tidy[1,]))){separator="|"message("Detected | separator for GT genotype format in cluster vcf")}elseif(any(grepl("/",cluster_geno_tidy[1,]))){separator="/"message("Detected / separator for GT genotype format in cluster vcf")}else{format_clust=NA
message("Can't identify a separator for the GT field in cluster vcf, moving on to using GP.")}cluster_geno_tidy<-as_tibble(lapply(cluster_geno_tidy,function(x){gsub(paste0("0",separator,"0"),0,x)})%>%
lapply(.,function(x){gsub(paste0("0",separator,"1"),1,x)})%>%
lapply(.,function(x){gsub(paste0("1",separator,"0"),1,x)})%>%
lapply(.,function(x){gsub(paste0("1",separator,"1"),2,x)}))}}## GP ##if(is.na(format_clust)){cluster_geno_tidy<-as_tibble(extract.gt(element="GP",cluster_geno,IDtoRowNames=F))if(!all(colSums(is.na(cluster_geno_tidy))==nrow(cluster_geno_tidy))){format_clust="GP"cluster_geno_tidy<-calculate_DS(cluster_geno_tidy)message("Found GP genotype format in cluster vcf. Will use that metric for cluster correlation.")}else{print("Could not identify the expected genotype format fields (DS, GT or GP) in your cluster vcf. Please check the vcf file and make sure that one of the expected genotype format fields is included or run manually with your genotype format field of choice. Quitting")q()}}### Reference VCF ###### Check for each of the different genotype formats #### DS ##format_ref=NA
ref_geno_tidy<-as_tibble(extract.gt(element="DS",ref_geno,IDtoRowNames=F))if(!all(colSums(is.na(ref_geno_tidy))==nrow(ref_geno_tidy))){message("Found DS genotype format in reference vcf. Will use that metric for cluster correlation.")format_ref="DS"}## GT ##if(is.na(format_ref)){ref_geno_tidy<-as_tibble(extract.gt(element="GT",ref_geno,IDtoRowNames=F))if(!all(colSums(is.na(ref_geno_tidy))==nrow(ref_geno_tidy))){message("Found GT genotype format in reference vcf. Will use that metric for cluster correlation.")format_ref="GT"if(any(grepl("\\|",ref_geno_tidy[1,]))){separator="|"message("Detected | separator for GT genotype format in reference vcf")}elseif(any(grepl("/",ref_geno_tidy[1,]))){separator="/"message("Detected / separator for GT genotype format in reference vcf")}else{format_ref=NA
message("Can't identify a separator for the GT field in reference vcf, moving on to using GP.")}ref_geno_tidy<-as_tibble(lapply(ref_geno_tidy,function(x){gsub(paste0("0",separator,"0"),0,x)})%>%
lapply(.,function(x){gsub(paste0("0",separator,"1"),1,x)})%>%
lapply(.,function(x){gsub(paste0("1",separator,"0"),1,x)})%>%
lapply(.,function(x){gsub(paste0("1",separator,"1"),2,x)}))}}## GP ##if(is.na(format_ref)){ref_geno_tidy<-as_tibble(extract.gt(element="GP",ref_geno,IDtoRowNames=F))if(!all(colSums(is.na(ref_geno_tidy))==nrow(ref_geno_tidy))){format_clust="GP"ref_geno_tidy<-calculate_DS(ref_geno_tidy)message("Found GP genotype format in cluster vcf. Will use that metric for cluster correlation.")}else{print("Could not identify the expected genotype format fields (DS, GT or GP) in your cluster vcf. Please check the vcf file and make sure that one of the expected genotype format fields is included or run manually with your genotype format field of choice. Quitting")q()}}### Get SNP IDs that will match between reference and cluster ##### Account for possibility that the ref or alt might be missingif((all(is.na(cluster_geno@fix[,'REF']))&all(is.na(cluster_geno@fix[,'ALT'])))|(all(is.na(ref_geno@fix[,'REF']))&all(is.na(ref_geno@fix[,'ALT'])))){message("The REF and ALT categories are not provided for the reference and/or the cluster vcf. Will use just the chromosome and position to match SNPs.")cluster_geno_tidy$ID<-paste0(cluster_geno@fix[,'CHROM'],":",cluster_geno@fix[,'POS'])ref_geno_tidy$ID<-paste0(ref_geno@fix[,'CHROM'],":",ref_geno@fix[,'POS'])}elseif(all(is.na(cluster_geno@fix[,'REF']))|all(is.na(ref_geno@fix[,'REF']))){message("The REF categories are not provided for the reference and/or the cluster vcf. Will use the chromosome, position and ALT to match SNPs.")cluster_geno_tidy$ID<-paste0(cluster_geno@fix[,'CHROM'],":",cluster_geno@fix[,'POS'],"_",cluster_geno@fix[,'REF'])ref_geno_tidy$ID<-paste0(ref_geno@fix[,'CHROM'],":",ref_geno@fix[,'POS'],"_",ref_geno@fix[,'REF'])}elseif(all(is.na(cluster_geno@fix[,'ALT']))|all(is.na(ref_geno@fix[,'ALT']))){message("The ALT categories are not provided for the reference and/or the cluster vcf. Will use the chromosome, position and REF to match SNPs.")cluster_geno_tidy$ID<-paste0(cluster_geno@fix[,'CHROM'],":",cluster_geno@fix[,'POS'],"_",cluster_geno@fix[,'ALT'])ref_geno_tidy$ID<-paste0(ref_geno@fix[,'CHROM'],":",ref_geno@fix[,'POS'],"_",ref_geno@fix[,'ALT'])}else{message("Found REF and ALT in both cluster and reference genotype vcfs. Will use chromosome, position, REF and ALT to match SNPs.")cluster_geno_tidy$ID<-paste0(cluster_geno@fix[,'CHROM'],":",cluster_geno@fix[,'POS'],"_",cluster_geno@fix[,'REF'],"_",cluster_geno@fix[,'ALT'])ref_geno_tidy$ID<-paste0(ref_geno@fix[,'CHROM'],":",ref_geno@fix[,'POS'],"_",ref_geno@fix[,'REF'],"_",ref_geno@fix[,'ALT'])}### Update the vcf dfs to remove SNPs with no genotyopes
cluster_geno_tidy<-cluster_geno_tidy[colSums(!is.na(cluster_geno_tidy))>0]
ref_geno_tidy<-ref_geno_tidy[colSums(!is.na(ref_geno_tidy))>0]########## Get a unique list of SNPs that is in both the reference and cluster genotypes ##########
locations<-inner_join(ref_geno_tidy[,"ID"],cluster_geno_tidy[,"ID"])
locations<-locations[!(locations$ID%in%locations[duplicated(locations),]$ID),]########## Keep just the SNPs that overlap ##########
ref_geno_tidy<-left_join(locations,ref_geno_tidy)
cluster_geno_tidy<-left_join(locations,cluster_geno_tidy)########## Correlate all the cluster genotypes with the individuals genotyped ############### Make a dataframe that has the clusters as the row names and the individuals as the column names #####
pearson_correlations<-as.data.frame(matrix(nrow=(ncol(cluster_geno_tidy)-1),ncol=(ncol(ref_geno_tidy)-1)))
colnames(pearson_correlations)<-colnames(ref_geno_tidy)[2:(ncol(ref_geno_tidy))]
rownames(pearson_correlations)<-colnames(cluster_geno_tidy)[2:(ncol(cluster_geno_tidy))]
pearson_correlations<-pearson_correlation(pearson_correlations,ref_geno_tidy,cluster_geno_tidy)
cluster<-data.frame("Cluster"=rownames(pearson_correlations))
pearson_correlations_out<-cbind(cluster,pearson_correlations)########## Save the correlation dataframes ##########
write_delim(pearson_correlations_out,file=paste0(outdir,"/ref_clust_pearson_correlations.tsv"),delim="\t")########## Create correlation figures ##########col_fun=colorRampPalette(c("white","red"))(101)
pPearsonCorrelations<-Heatmap(as.matrix(pearson_correlations),cluster_rows=T,col=col_fun)########## Save the correlation figures ##########
png(filename=paste0(outdir,"/ref_clust_pearson_correlation.png"),width=500)
print(pPearsonCorrelations)
dev.off()########## Assign individual to cluster based on highest correlating individual ##########
key<-as.data.frame(matrix(nrow=ncol(pearson_correlations),ncol=3))
colnames(key)<-c("Genotype_ID","Cluster_ID","Correlation")
key$Genotype_ID<-colnames(pearson_correlations)for(idinkey$Genotype_ID){if(max(pearson_correlations[,id])==max(pearson_correlations[rownames(pearson_correlations)[which.max(pearson_correlations[,id])],])){key$Cluster_ID[which(key$Genotype_ID==id)]<-rownames(pearson_correlations)[which.max(pearson_correlations[,id])]key$Correlation[which(key$Genotype_ID==id)]<-max(pearson_correlations[,id])}else{key$Cluster_ID[which(key$Genotype_ID==id)]<-"unassigned"key$Correlation[which(key$Genotype_ID==id)]<-NA
}}
write_delim(key,file=paste0(outdir,"/Genotype_ID_key.txt"),delim="\t")
After running the ScSplit steps and summarizing the results, you will have a number of files from some of the intermediary steps. Theses are the files that most users will find the most informative:
scSplit_doublets_singlets.csv
The droplet assignment results. The first column is the droplet barcode and the second column is the droplet type and cluster assignment separated by a dash. For example SNG-9 would indicate that cluster 9 are singlets.
Barcode
Cluster
AAACCTGTCCGAATGT-1
SNG-0
AAACGGGAGTTGAGAT-1
SNG-0
AAACGGGCATGTCTCC-1
SNG-0
AAACGGGTCCACGAAT-1
SNG-0
AAACGGGTCCAGTAGT-1
SNG-0
AAACGGGTCGGCTTGG-1
SNG-0
AAAGATGTCCGAACGC-1
SNG-0
AAAGATGTCCGTCAAA-1
SNG-0
AAAGTAGCATCACGTA-1
SNG-0
…
…
If you ran the Assign_Indiv_by_Geno.R script, you will also have the following files:
Genotype_ID_key.txt
Key of the cluster and assignments for each individual and the Pearson correlation coefficient.
Genotype_ID
Cluster_ID
Correlation
113_113
12
0.6448151
349_350
14
0.6663323
352_353
7
0.6596409
39_39
6
0.6398297
40_40
9
0.6191905
41_41
3
0.6324396
42_42
4
0.6560180
43_43
5
0.6672336
465_466
11
0.6297396
596_597
13
0.6273717
597_598
10
0.6627428
632_633
1
0.5899685
633_634
0
0.6157936
660_661
8
0.6423770
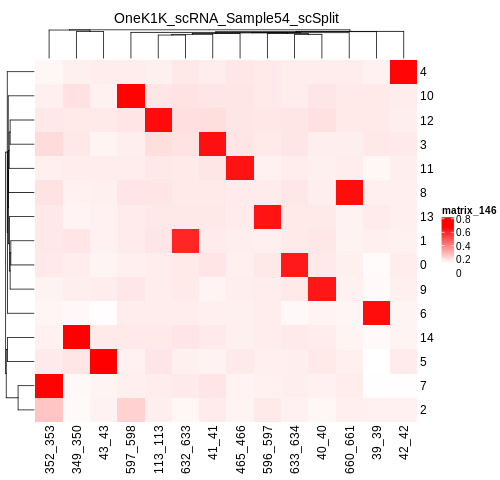
ref_clust_pearson_correlation.png
Figure of the Pearson correlation coefficients for each cluster-individual pair.
ref_clust_pearson_correlations.tsv
All of the Pearson correlation coefficients between the clusters and the individuals