Freemuxlet
Freemuxlet is a genotype-free demultiplexing software that does not require you to have SNP genotypes the donors in your multiplexed capture. In fact, it can’t natively integrate SNP genotypes into the demultiplexing. We have provided some scripts that will help identify clusters from given donors if you do have SNP genotypes but use Freemuxlet. However, it might be better to use a software that is designed integrate SNP genotypes while assigning donor/cluster (Demuxlet, Souporcell or Vireo).
Data
This is the data that you will need to have prepare to run Freemuxlet:
Required
Common SNP genotypes vcf (
$VCF)While not exactly required, using common SNP genotype locations enhances accuracy
If you have reference SNP genotypes for individuals in your pool, you can use those
If you do not have reference SNP genotypes, they can be from any large population resource (i.e. 1000 Genomes or HRC)
Filter for common SNPs (> 5% minor allele frequency) and SNPs overlapping genes
Barcode file (
$BARCODES)Number of samples in pool (
$N)Bam file (
$BAM)Aligned single cell reads
Output directory (
$FREEMUXLET_OUTDIR)
Run Freemuxlet
Popscle Pileup
First we will need to identify the number of reads from each allele at each of the common SNP location:
singularity exec Demuxafy.sif popscle dsc-pileup --sam $BAM --vcf $VCF --group-list $BARCODES --out $FREEMUXLET_OUTDIR/pileup
If the pileup is successfull, you will have these files in your $FREEMUXLET_OUTDIR:
.
├── pileup.cel.gz
├── pileup.plp.gz
├── pileup.umi.gz
└── pileup.var.gz
Additional details about outputs are available below in the Freemuxlet Results and Interpretation.
Popscle Freemuxlet
Once you have run popscle pileup, you can demultiplex your samples with Freemuxlet:
singularity exec Demuxafy.sif popscle freemuxlet --plp $FREEMUXLET_OUTDIR/pileup --out $FREEMUXLET_OUTDIR/freemuxlet --group-list $BARCODES --nsample $N
If freemuxlet is successfull, you will have these new files in your $FREEMUXLET_OUTDIR:
.
├── freemuxlet.clust1.samples.gz
├── freemuxlet.clust1.vcf.gz
├── freemuxlet.lmix
├── pileup.cel.gz
├── pileup.plp.gz
├── pileup.umi.gz
└── pileup.var.gz
Additional details about outputs are available below in the Freemuxlet Results and Interpretation.
Freemuxlet Summary
We have provided a script that will summarize the number of droplets classified as doublets, ambiguous and assigned to each donor by Freemuxlet and write it to the $FREEMUXLET_OUTDIR.
You can run this to get a fast and easy summary of your results by providing the result file of interest:
singularity exec Demuxafy.sif bash Freemuxlet_summary.sh $FREEMUXLET_OUTDIR/freemuxlet.clust1.samples.gz
which will return:
Classification
Assignment N
0
1575
1
1278
10
972
11
1477
12
1630
13
1446
2
1101
3
1150
4
1356
5
1540
6
1110
7
1313
8
1383
9
884
DBL
2767
or you can write it straight to a file:
singularity exec Demuxafy.sif bash Freemuxlet_summary.sh $FREEMUXLET_OUTDIR/freemuxlet.clust1.samples.gz > $FREEMUXLET_OUTDIR/freemuxlet_summary.tsv
Note
To check if these numbers are consistent with the expected doublet rate in your dataset, you can use our Doublet Estimation Calculator.
Correlating Cluster to Donor Reference SNP Genotypes (optional)
If you have reference SNP genotypes for some or all of the donors in your pool, you can identify which cluster is best correlated with each donor in your reference SNP genotypes. We have provided a script that will do this and provide a heatmap correlation figure and the predicted individual that should be assigned for each cluster. You can either run it with the script by providing the reference SNP genotypes ($VCF), the cluster SNP genotypes ($FREEMUXLET_OUTDIR/freemuxletOUT.clust1.vcf.gz) and the output directory ($FREEMUXLET_OUTDIR) You can run this script with:
Note
In order to do this, your $VCF must be reference SNP genotypes for the individuals in the pool and cannot be a general vcf with common SNP genotype locations from 1000 Genomes or HRC.
singularity exec Demuxafy.sif Assign_Indiv_by_Geno.R -r $VCF -c $FREEMUXLET_OUTDIR/freemuxlet.clust1.vcf.gz -o $FREEMUXLET_OUTDIR
To see the parameter help menu, type:
singularity exec Demuxafy.sif Assign_Indiv_by_Geno.R -h
Which will print:
usage: Assign_Indiv_by_Geno.R [-h] -r REFERENCE_VCF -c CLUSTER_VCF -o OUTDIR

optional arguments:
-h, --help            show this help message and exit
-r REFERENCE_VCF, --reference_vcf REFERENCE_VCF
                                                The output directory where results will be saved
-c CLUSTER_VCF, --cluster_vcf CLUSTER_VCF
                                                A QC, normalized seurat object with
                                                classifications/clusters as Idents().
-o OUTDIR, --outdir OUTDIR
                                                Number of genes to use in
                                                'Improved_Seurat_Pre_Process' function.
You can run the reference vs cluster genotypes manually (possibly because your data doesn’t have GT, DS or GP genotype formats) or because you would prefer to alter some of the steps. To run the correlations manually, simply start R from the singularity image:
singularity exec Demuxafy.sif R
Once, R has started, you can load the required libraries (included in the singularity image) and run the code.
.libPaths("/usr/local/lib/R/site-library") ### Required so that libraries are loaded from the image instead of locally
library(tidyr)
library(tidyverse)
library(dplyr)
library(vcfR)
library(lsa)
library(ComplexHeatmap)


########## Set up paths and variables ##########

reference_vcf <- "/path/to/reference.vcf"
cluster_vcf <- "/path/to/freemuxlet/out/freemuxletOUT.clust1.vcf.gz"
outdir <- "/path/to/freemuxlet/out/"


########## Set up functions ##########
##### Calculate DS from GP if genotypes in that format #####
calculate_DS <- function(GP_df){
    columns <- c()
    for (i in 1:ncol(GP_df)){
        columns <- c(columns, paste0(colnames(GP_df)[i],"-0"), paste0(colnames(GP_df)[i],"-1"), paste0(colnames(GP_df)[i],"-2"))
    }
    df <- GP_df
    colnames(df) <- paste0("c", colnames(df))
    colnames_orig <- colnames(df)
    for (i in 1:length(colnames_orig)){
        df <- separate(df, sep = ",", col = colnames_orig[i], into = columns[(1+(3*(i-1))):(3+(3*(i-1)))])
    }
    df <- mutate_all(df, function(x) as.numeric(as.character(x)))
    for (i in 1: ncol(GP_df)){
        GP_df[,i] <- df[,(2+((i-1)*3))] + 2* df[,(3+((i-1)*3))]
    }
    return(GP_df)
}

pearson_correlation <- function(df, ref_df, clust_df){
    for (col in colnames(df)){
        for (row in rownames(df)){
            df[row,col] <- cor(as.numeric(pull(ref_df, col)), as.numeric(pull(clust_df, row)), method = "pearson", use = "complete.obs")
        }
    }
    return(df)
}


########## Read in vcf files for each of three non-reference genotype softwares ##########
ref_geno <- read.vcfR(reference_vcf)
cluster_geno <- read.vcfR(cluster_vcf)


########## Convert to tidy data frame ##########
####### Identify which genotype FORMAT to use #######
##### Cluster VCF #####
### Check for each of the different genotype formats ##
## DS ##
format_clust=NA
cluster_geno_tidy <- as_tibble(extract.gt(element = "DS",cluster_geno, IDtoRowNames = F))
if (!all(colSums(is.na(cluster_geno_tidy)) == nrow(cluster_geno_tidy))){
  message("Found DS genotype format in cluster vcf. Will use that metric for cluster correlation.")
  format_clust = "DS"
}

## GT ##
if (is.na(format_clust)){
  cluster_geno_tidy <- as_tibble(extract.gt(element = "GT",cluster_geno, IDtoRowNames = F))
  if (!all(colSums(is.na(cluster_geno_tidy)) == nrow(cluster_geno_tidy))){
    message("Found GT genotype format in cluster vcf. Will use that metric for cluster correlation.")
    format_clust = "GT"

    if (any(grepl("\\|",cluster_geno_tidy[1,]))){
      separator = "|"
      message("Detected | separator for GT genotype format in cluster vcf")
    } else if (any(grepl("/",cluster_geno_tidy[1,]))) {
      separator = "/"
      message("Detected / separator for GT genotype format in cluster vcf")
    } else {
      format_clust = NA
      message("Can't identify a separator for the GT field in cluster vcf, moving on to using GP.")
    }

    cluster_geno_tidy <- as_tibble(lapply(cluster_geno_tidy, function(x) {gsub(paste0("0",separator,"0"),0, x)}) %>%
                            lapply(., function(x) {gsub(paste0("0",separator,"1"),1, x)}) %>%
                            lapply(., function(x) {gsub(paste0("1",separator,"0"),1, x)}) %>%
                            lapply(., function(x) {gsub(paste0("1",separator,"1"),2, x)}))

  }
}

## GP ##
if (is.na(format_clust)){
  cluster_geno_tidy <- as_tibble(extract.gt(element = "GP",cluster_geno, IDtoRowNames =F))
  if (!all(colSums(is.na(cluster_geno_tidy)) == nrow(cluster_geno_tidy))){
    format_clust = "GP"
    cluster_geno_tidy <- calculate_DS(cluster_geno_tidy)
    message("Found GP genotype format in cluster vcf. Will use that metric for cluster correlation.")

  } else {
    print("Could not identify the expected genotype format fields (DS, GT or GP) in your cluster vcf. Please check the vcf file and make sure that one of the expected genotype format fields is included or run manually with your genotype format field of choice. Quitting")
    q()
  }
}


### Reference VCF ###
### Check for each of the different genotype formats ##
## DS ##
format_ref = NA
ref_geno_tidy <- as_tibble(extract.gt(element = "DS",ref_geno, IDtoRowNames = F))
if (!all(colSums(is.na(ref_geno_tidy)) == nrow(ref_geno_tidy))){
  message("Found DS genotype format in reference vcf. Will use that metric for cluster correlation.")
  format_ref = "DS"
}

## GT ##
if (is.na(format_ref)){
  ref_geno_tidy <- as_tibble(extract.gt(element = "GT",ref_geno, IDtoRowNames = F))
  if (!all(colSums(is.na(ref_geno_tidy)) == nrow(ref_geno_tidy))){
    message("Found GT genotype format in reference vcf. Will use that metric for cluster correlation.")
    format_ref = "GT"

    if (any(grepl("\\|",ref_geno_tidy[1,]))){
      separator = "|"
      message("Detected | separator for GT genotype format in reference vcf")
    } else if (any(grepl("/",ref_geno_tidy[1,]))) {
      separator = "/"
      message("Detected / separator for GT genotype format in reference vcf")
    } else {
      format_ref = NA
      message("Can't identify a separator for the GT field in reference vcf, moving on to using GP.")
    }

    ref_geno_tidy <- as_tibble(lapply(ref_geno_tidy, function(x) {gsub(paste0("0",separator,"0"),0, x)}) %>%
                            lapply(., function(x) {gsub(paste0("0",separator,"1"),1, x)}) %>%
                            lapply(., function(x) {gsub(paste0("1",separator,"0"),1, x)}) %>%
                            lapply(., function(x) {gsub(paste0("1",separator,"1"),2, x)}))

  }
}

## GP ##
if (is.na(format_ref)){
  ref_geno_tidy <- as_tibble(extract.gt(element = "GP",ref_geno, IDtoRowNames = F))
  if (!all(colSums(is.na(ref_geno_tidy)) == nrow(ref_geno_tidy))){
    format_clust = "GP"
    ref_geno_tidy <- calculate_DS(ref_geno_tidy)
    message("Found GP genotype format in cluster vcf. Will use that metric for cluster correlation.")

  } else {
    print("Could not identify the expected genotype format fields (DS, GT or GP) in your cluster vcf. Please check the vcf file and make sure that one of the expected genotype format fields is included or run manually with your genotype format field of choice. Quitting")
    q()
  }
}


### Get SNP IDs that will match between reference and cluster ###
## Account for possibility that the ref or alt might be missing
if ((all(is.na(cluster_geno@fix[,'REF'])) & all(is.na(cluster_geno@fix[,'ALT']))) | (all(is.na(ref_geno@fix[,'REF'])) & all(is.na(ref_geno@fix[,'ALT'])))){
  message("The REF and ALT categories are not provided for the reference and/or the cluster vcf. Will use just the chromosome and position to match SNPs.")
  cluster_geno_tidy$ID <- paste0(cluster_geno@fix[,'CHROM'],":", cluster_geno@fix[,'POS'])
  ref_geno_tidy$ID <- paste0(ref_geno@fix[,'CHROM'],":", ref_geno@fix[,'POS'])
} else if (all(is.na(cluster_geno@fix[,'REF'])) | all(is.na(ref_geno@fix[,'REF']))){
  message("The REF categories are not provided for the reference and/or the cluster vcf. Will use the chromosome, position and ALT to match SNPs.")
  cluster_geno_tidy$ID <- paste0(cluster_geno@fix[,'CHROM'],":", cluster_geno@fix[,'POS'],"_", cluster_geno@fix[,'REF'])
  ref_geno_tidy$ID <- paste0(ref_geno@fix[,'CHROM'],":", ref_geno@fix[,'POS'],"_", ref_geno@fix[,'REF'])
} else if (all(is.na(cluster_geno@fix[,'ALT'])) | all(is.na(ref_geno@fix[,'ALT']))){
  message("The ALT categories are not provided for the reference and/or the cluster vcf. Will use the chromosome, position and REF to match SNPs.")
  cluster_geno_tidy$ID <- paste0(cluster_geno@fix[,'CHROM'],":", cluster_geno@fix[,'POS'],"_", cluster_geno@fix[,'ALT'])
  ref_geno_tidy$ID <- paste0(ref_geno@fix[,'CHROM'],":", ref_geno@fix[,'POS'],"_", ref_geno@fix[,'ALT'])
} else {
  message("Found REF and ALT in both cluster and reference genotype vcfs. Will use chromosome, position, REF and ALT to match SNPs.")
    cluster_geno_tidy$ID <- paste0(cluster_geno@fix[,'CHROM'],":", cluster_geno@fix[,'POS'],"_", cluster_geno@fix[,'REF'],"_", cluster_geno@fix[,'ALT'])
  ref_geno_tidy$ID <- paste0(ref_geno@fix[,'CHROM'],":", ref_geno@fix[,'POS'],"_", ref_geno@fix[,'REF'],"_", ref_geno@fix[,'ALT'])
}


### Update the vcf dfs to remove SNPs with no genotyopes
cluster_geno_tidy <- cluster_geno_tidy[colSums(!is.na(cluster_geno_tidy)) > 0]
ref_geno_tidy <- ref_geno_tidy[colSums(!is.na(ref_geno_tidy)) > 0]


########## Get a unique list of SNPs that is in both the reference and cluster genotypes ##########
locations  <- inner_join(ref_geno_tidy[,"ID"],cluster_geno_tidy[,"ID"])
locations <- locations[!(locations$ID %in% locations[duplicated(locations),]$ID),]

########## Keep just the SNPs that overlap ##########
ref_geno_tidy <- left_join(locations, ref_geno_tidy)
cluster_geno_tidy <- left_join(locations, cluster_geno_tidy)

########## Correlate all the cluster genotypes with the individuals genotyped ##########
##### Make a dataframe that has the clusters as the row names and the individuals as the column names #####
pearson_correlations <- as.data.frame(matrix(nrow = (ncol(cluster_geno_tidy) -1), ncol = (ncol(ref_geno_tidy) -1)))
colnames(pearson_correlations) <- colnames(ref_geno_tidy)[2:(ncol(ref_geno_tidy))]
rownames(pearson_correlations) <- colnames(cluster_geno_tidy)[2:(ncol(cluster_geno_tidy))]
pearson_correlations <- pearson_correlation(pearson_correlations, ref_geno_tidy, cluster_geno_tidy)
cluster <- data.frame("Cluster" = rownames(pearson_correlations))
pearson_correlations_out <- cbind(cluster, pearson_correlations)

########## Save the correlation dataframes ##########
write_delim(pearson_correlations_out, file = paste0(outdir,"/ref_clust_pearson_correlations.tsv"), delim = "\t" )


########## Create correlation figures ##########
col_fun = colorRampPalette(c("white", "red"))(101)
pPearsonCorrelations <- Heatmap(as.matrix(pearson_correlations), cluster_rows = T, col = col_fun)

########## Save the correlation figures ##########
png(filename = paste0(outdir,"/ref_clust_pearson_correlation.png"), width = 500)
print(pPearsonCorrelations)
dev.off()

########## Assign individual to cluster based on highest correlating individual ##########
key <- as.data.frame(matrix(nrow = ncol(pearson_correlations), ncol = 3))
colnames(key) <- c("Genotype_ID","Cluster_ID","Correlation")
key$Genotype_ID <- colnames(pearson_correlations)
for (id in key$Genotype_ID){
    if (max(pearson_correlations[,id]) == max(pearson_correlations[rownames(pearson_correlations)[which.max(pearson_correlations[,id])],])){
        key$Cluster_ID[which(key$Genotype_ID == id)] <- rownames(pearson_correlations)[which.max(pearson_correlations[,id])]
        key$Correlation[which(key$Genotype_ID == id)] <- max(pearson_correlations[,id])
    } else {
        key$Cluster_ID[which(key$Genotype_ID == id)] <- "unassigned"
        key$Correlation[which(key$Genotype_ID == id)] <- NA
    }
}

write_delim(key, file = paste0(outdir,"/Genotype_ID_key.txt"), delim = "\t")
After correlating the reference SNP genotypes with the cluster SNP genotypes using either the script or manually, you should have three new files in your $FREEMUXLET_OUTDIR:
.
├── freemuxlet.clust1.samples.gz
├── freemuxlet.clust1.vcf.gz
├── freemuxlet.lmix
├── freemuxlet_summary.tsv
├── Genotype_ID_key.txt
├── pileup.cel.gz
├── pileup.plp.gz
├── pileup.umi.gz
├── pileup.var.gz
├── ref_clust_pearson_correlation.png
└── ref_clust_pearson_correlations.tsv
Freemuxlet Results and Interpretation
After running the Freemuxlet steps and summarizing the results, you will have a number of files from some of the intermediary steps. Theses are the files that most users will find the most informative:
freemuxlet.clust1.samples.gz
Metrics for each droplet including the singlet, doublet or ambiguous assignment (
DROPLET.TYPE), final assignment (BEST.GUESS), log likelihood of the final assignment (BEST.LLK) and other QC metrics.
INT_ID
BARCODE
NUM.SNPS
NUM.READS
DROPLET.TYPE
BEST.GUESS
BEST.LLK
NEXT.GUESS
NEXT.LLK
DIFF.LLK.BEST.NEXT
BEST.POSTERIOR
SNG.POSTERIOR
SNG.BEST.GUESS
SNG.BEST.LLK
SNG.NEXT.GUESS
SNG.NEXT.LLK
SNG.ONLY.POSTERIOR
DBL.BEST.GUESS
DBL.BEST.LLK
DIFF.LLK.SNG.DBL
0
GTGAAGGTCCGCGTTT-1
600
1050
DBL
12,1
-1001.09
12,4
-1030.21
29.13
-0.00000
6.7e-16
12
-1037.90
1
-1135.80
1.00000
12,1
-1001.09
-36.81
1
CGAGAAGTCCTCAACC-1
354
578
SNG
7,7
-560.30
13,7
-583.64
23.35
-0.00000
1
7
-560.30
13
-650.83
1.00000
13,7
-583.64
23.35
2
CGCTTCATCGGTGTCG-1
1029
2847
DBL
9,3
-1651.22
9,6
-1777.52
126.31
0.00000
1.5e-65
9
-1802.35
3
-1838.25
1.00000
9,3
-1651.22
-151.13
3
CAGCGACTCGTCGTTC-1
167
229
SNG
5,5
-261.97
6,5
-272.51
10.54
-0.00001
1
5
-261.97
6
-303.97
1.00000
6,5
-272.51
10.54
4
CGTAGGCAGGCCGAAT-1
287
465
SNG
1,1
-451.79
4,1
-479.98
28.18
-0.00000
1
1
-451.79
10
-562.57
1.00000
4,1
-479.98
28.18
…
…
…
…
…
…
…
…
…
…
…
…
…
…
…
…
…
…
…
…
If you ran the Assign_Indiv_by_Geno.R script, you will also have the following files:
Genotype_ID_key.txt
Key of the cluster and assignments for each individual and the pearson correlation coefficient.
Genotype_ID
Cluster_ID
Correlation
113_113
CLUST4
0.7939599
349_350
CLUST11
0.7954687
352_353
CLUST12
0.7962697
39_39
CLUST7
0.7927807
40_40
CLUST6
0.7833879
41_41
CLUST3
0.7877763
42_42
CLUST13
0.7915233
43_43
CLUST0
0.8008066
465_466
CLUST2
0.7849719
596_597
CLUST1
0.7883125
597_598
CLUST5
0.7996224
632_633
CLUST9
0.7904012
633_634
CLUST10
0.7834359
660_661
CLUST8
0.7914850
ref_clust_pearson_correlation.png
Figure of the pearson correlation coefficients for each cluster-individual pair.
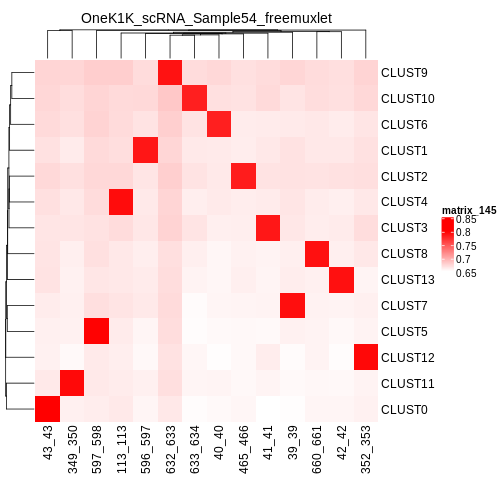
ref_clust_pearson_correlations.tsv
All of the pearson correlation coefficients between the clusters and the individuals
Cluster
113_113
349_350
352_353
39_39
40_40
…
0
0.6710138155015287
0.6670772417845169
0.6662437546886375
0.659705934873083
0.661561196478371
…
1
0.6768324504112175
0.6698041245221165
0.6753365794834155
0.6746102593436571
0.670220232713515
…
2
0.680371000427
0.6756606413629137
0.6764869329887958
0.6742600575280224
0.6712474637813011
…
3
0.678245260602395
0.6729013367875729
0.6773636626488672
0.6719793480269676
0.6672767277830997
…
4
0.7939598604862043
0.6714745697877756
0.6713909926031749
0.673064058187681
0.6702690169292862
…
…
…
…
…
…
…
…
Merging Results with Other Software Results
We have provided a script that will help merge and summarize the results from multiple softwares together. See Combine Results.
Citation
If you used the Demuxafy platform for analysis, please reference our paper (REFERENCE) as well as Freemuxlet.